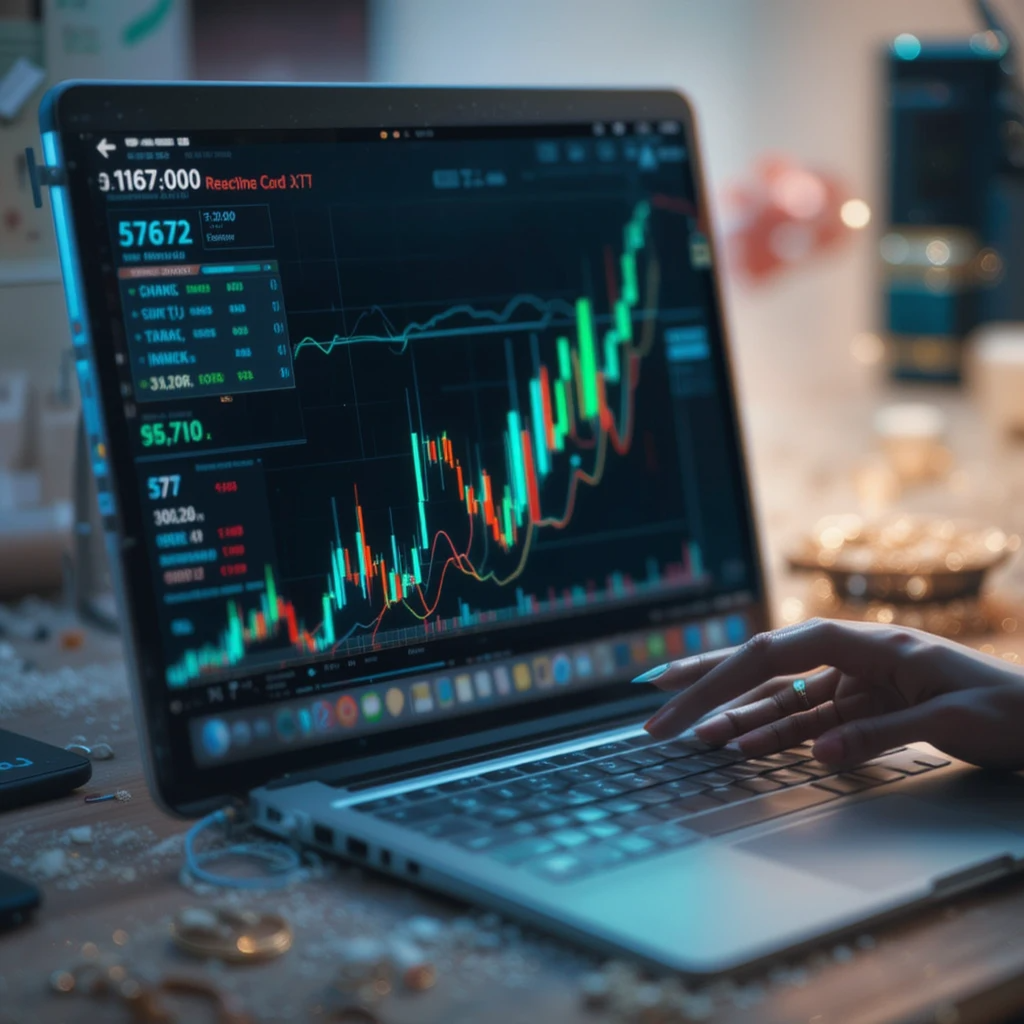
If you’ve ever looked at a crypto chart and felt lost, you’re not alone. Between candlesticks, moving averages, and all those squiggly lines—it can feel like reading a foreign language. But here’s the truth: reading crypto charts is one of the most powerful skills a beginner can learn.
Charts tell you the story behind price movements—who’s buying, who’s selling, and when momentum might shift. Once you know how to read them, you can spot trends, avoid emotional decisions, and make smarter investments or trades.
What Is a Crypto Chart?
A crypto chart is a visual representation of the price and trading activity of a cryptocurrency over time. It shows:
-
How prices move over minutes, hours, days, or weeks
-
Where buyers and sellers are most active
-
Patterns that hint at future movements
There are three main types of crypto charts:
-
Line Charts – Connect closing prices over time.
-
Bar Charts – Show high, low, open, and close prices.
-
Candlestick Charts – The most detailed and widely used.
Understanding Chart Timeframes
Chart timeframes reflect how much data is shown in each point or candle.
| Timeframe | Use Case |
|---|---|
| 1-Minute (1M) | Scalping and rapid trades |
| 1-Hour (1H) | Intraday trading |
| 4-Hour (4H) | Mid-term trend spotting |
| 1-Day (1D) | Long-term analysis |
| 1-Week (1W) | Macro trends and investor outlooks |
Beginners should focus on daily and weekly charts to avoid the noise of short-term fluctuations.
Types of Crypto Charts Explained
1. Line Charts
-
Simple and clean
-
Only shows closing prices
-
Great for a quick trend overview
2. Bar Charts
-
Displays open, high, low, and close
-
Less visual than candlesticks
-
Preferred in some traditional finance circles
3. Candlestick Charts
-
Most commonly used in crypto
-
Provides more visual info on market behavior
How to Read Candlestick Charts
Each candle represents a unit of time (e.g., 1 hour or 1 day).
🔍 Parts of a Candlestick:
-
Body: The range between opening and closing prices
-
Wick (Shadow): The high and low during that period
-
Color: Green (or white) = price up; Red (or black) = price down
🧠 Example:
-
A green candle with a long lower wick = Buyers stepped in after a dip
-
A red candle with a short body = Uncertain movement
Reading candles helps you understand market psychology—who’s in control: buyers or sellers.
Support and Resistance Levels
-
Support: A price level where buying pressure tends to prevent the price from falling further.
-
Resistance: A price level where selling pressure tends to stop upward movement.
When a price breaks above resistance, it often rises further. When it drops below support, further decline is likely.
Trend Lines and Chart Patterns
✏️ Trend Lines:
Drawn diagonally to connect higher lows (uptrend) or lower highs (downtrend).
🔁 Popular Patterns:
-
Triangles: Signal continuation or breakout
-
Head & Shoulders: Reversal pattern
-
Flags & Pennants: Indicate strong continuation
Patterns aren’t guarantees—but they’re useful guides for anticipating possible moves.
Volume and Its Role in Trends
Volume tells you how much crypto is being traded. It confirms the strength of a move.
-
High volume on price rise: Strong bullish momentum
-
Low volume on a breakout: May be a false signal
-
Sudden spikes in volume: Indicate heavy buying/selling pressure
Watch volume alongside price action for better insights.
Popular Indicators for Beginners
Indicators are tools that help predict price action or confirm trends.
| Indicator | Purpose |
|---|---|
| Moving Averages (MA, EMA) | Smooth out price data to show trends |
| Relative Strength Index (RSI) | Measures if a coin is overbought or oversold |
| MACD | Combines trend and momentum signals |
Start with one or two indicators, and always use them in combination—not in isolation.
Bullish vs Bearish Trends
-
Bullish: Price making higher highs and higher lows
-
Bearish: Price making lower highs and lower lows
Look for reversal signs like double bottoms (bullish) or shooting stars (bearish candlestick) to time entries or exits.
Mistakes Beginners Make When Reading Charts
-
❌ Overanalyzing: Too many indicators can cloud judgment
-
❌ Ignoring Timeframes: Zooming into the 1-minute chart creates unnecessary panic
-
❌ Letting Emotions Take Over: Stick to your strategy, not fear or hype
Practice makes perfect—and patience pays off.
Tools and Platforms to Practice Chart Reading
-
TradingView: Professional-grade charts with drawing tools
-
CoinMarketCap: Good for price history and simple line charts
-
Binance/Coinbase Pro: Built-in candlestick charts and volume indicators
Use free platforms to test and learn before risking money.
FAQs
Q1. What’s the best chart for beginners?
Candlestick charts offer the most useful information once you learn the basics.
Q2. How often should I check charts?
Once or twice daily is enough—especially if you’re not trading full-time.
Q3. Can I trade just by reading charts?
Yes, but combining technical and fundamental analysis is better.
Q4. What’s a candle wick?
It shows the high and low prices outside the open/close range.
Q5. How do I know when to buy?
Look for support zones, bullish patterns, and rising volume confirmation.
Q6. Are indicators always accurate?
No—they’re tools, not guarantees. Always use multiple confirmations.
Conclusion
Learning how to read crypto charts doesn’t require a finance degree—just curiosity, consistency, and practice. Over time, patterns will become familiar, indicators more meaningful, and decisions more confident.
Start simple, use tools like TradingView, and remember: the goal isn’t perfection—it’s progress. The more you study charts, the more clearly you’ll see the rhythms of the crypto market—and the smarter your investment decisions will become.

Leave a Reply